by Usama Ahmad | Nov 4, 2017 | New Features
Over the past couple of weeks now, we have been downloading orders and financial transactions every 30 minutes instead of every hour.
And by the looks of it, no one even noticed.
In the 20 months we have been operating since launch, no one has ever broached the subject of orders excessively lagging behind.
No one.
Even the XXL accounts (400,000 orders a month and more) have been happily operating with hourly order updates.
Nevertheless, we wanted to experiment and see how our servers would handle doubling their load. The experiment has allowed us to (extensively) optimize the application design and after the optimization, the doubling of the load results in only 9% more server resource utilization.
So, we’ll let the current configuration run for a bit longer (until we have about 5 weeks of performance data). We will then implement a scheme whereby high-volume accounts get refreshed every 15 to 30 minutes and low-volume accounts get refreshed every 45-60 minutes.
And no one will even notice. But it is a nice feature to have marketing-wise. We now just need to find a catchy (or nerdy) marketing name for that feature
by Usama Ahmad | Oct 20, 2017 | New Features
Over the past 18 months, we have had many support tickets questioning the accuracy of our revenue numbers, as they are not matching Amazon’s.
While we have an excellent knowledge base article about the subject, many of you were left incredulous, but were willing to give us the benefit of the doubt. Thank you for your trust.
Many others cancelled their subscription before the end of the trial, giving us the reason that they did not trust our numbers.
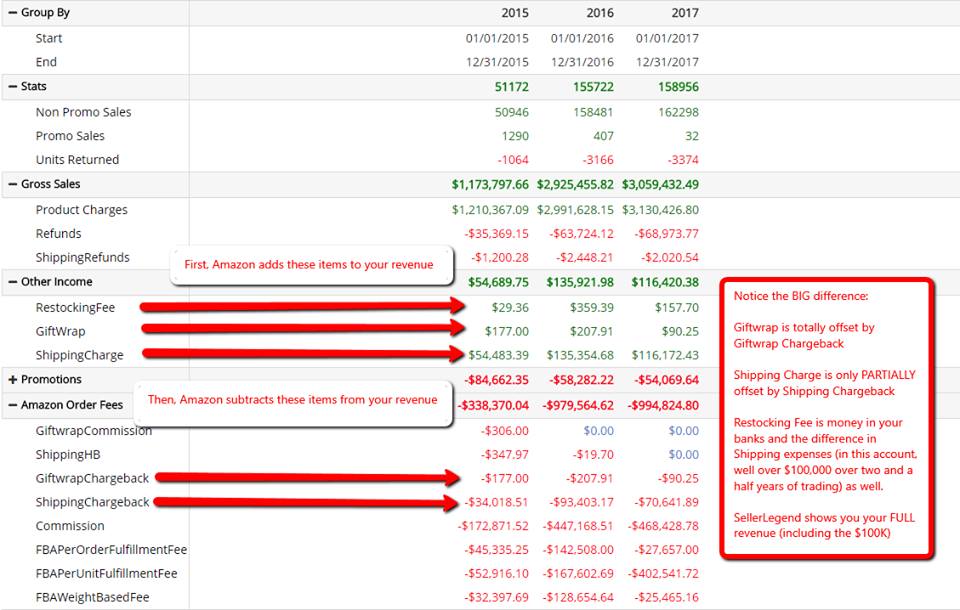
With the advent of the P&L report, we are now able to vividly demonstrate why our revenue numbers are (were) not matching SellerCentral’s dashboard numbers.
Below is a screenprint of a medium-sized account P&L Statement. Notice the large uplift in revenue when looking at the P&L over two and a half years of trading.
While we have demonstrable justification, many people will not care to ask why the difference and will just decide to cancel their subscription anyway during their trial. So, we have decided to do something about this.
To be continued ….
by Usama Ahmad | Oct 18, 2017 | New Features
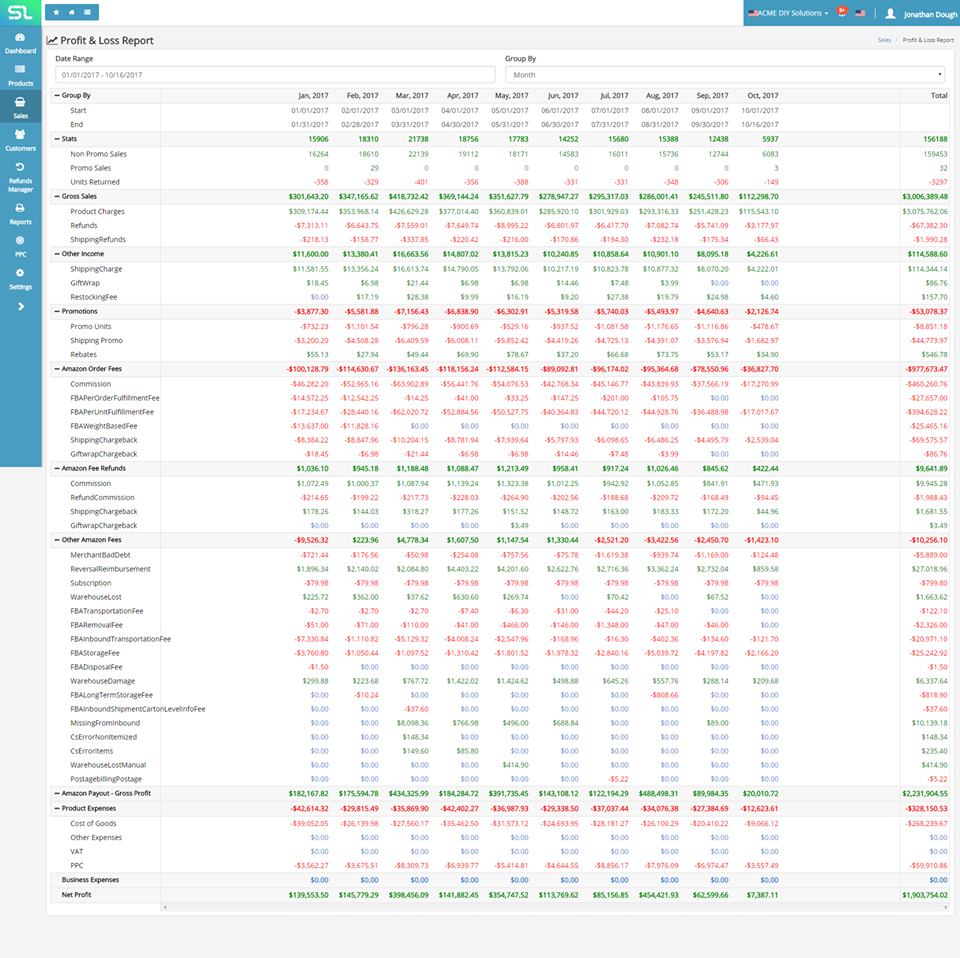
Deployed earlier today, under the menu Sales->Profit And Loss Report.
This is a report based on your settlement periods (Amazon Payments). It, therefore, reports on SETTLED orders.
You can now see settlement amounts across settlement periods. Indeed, you can view any time period and show the results by Day, Week, Month, Quarter, Year, and by settlement period within the time period.
I took the opportunity to take a screen print with our new default skin (not yet publicly available), however, if you preferred the old skin, it will still be available and you can choose your preferred colours.
The Knowledgebase article is being written as we speak, but this screen is quite self-explanatory.
by Usama Ahmad | Aug 17, 2017 | New Features
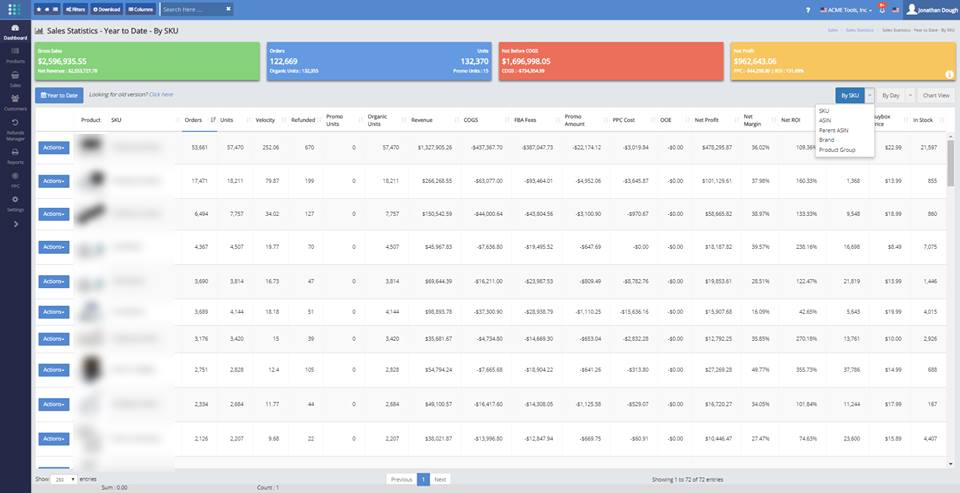
The sales statistics screen can now show the following combination of product sales data, over a user-selectable period of time:
– Sales By SKU
– Sales By ASIN
– Sales By Parent ASIN
– Sales By Product Group
– Sales By Brand
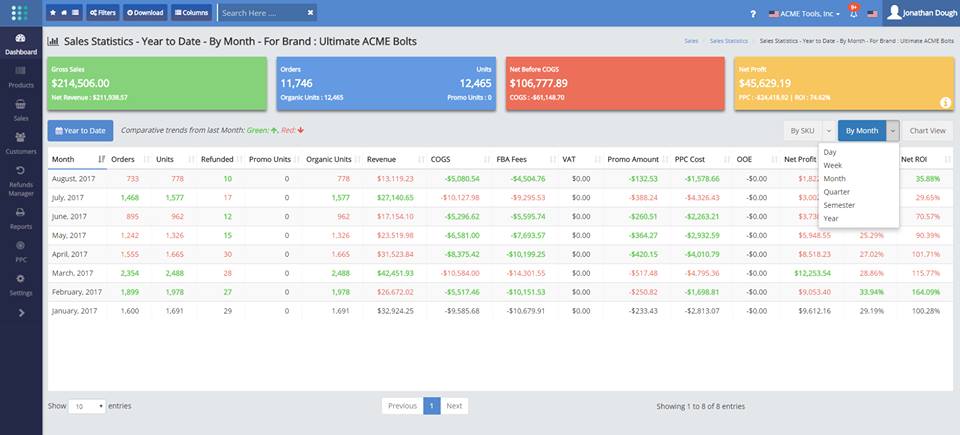
Moreover, for each of the above entities (SKU, ASIN, Parent ASIN, Product Group and Brand), you can show aggregate results by:
– Individual day during the selected period
– Individual week during the selected period
– Individual month during the selected period
– Individual quarter during the selected period
– Individual semester during the selected period, and
– Individual year during the selected period.
The screen now sports:
– A Period Selector
==> (Today, Yesterday, Last 7 Days, Last 30 Days, Last 90 Day, This Month, Last Month, Last 3 Months, Last Year, Year To Date, One Year, Custom)
– A Scope Selector
==> (By SKU, By ASIN, By Parent ASIN, By Brand, By Product Group)
– An Interval Selector
==> (By Day, By Week, By Month, By Quarter, By Semester, By Year)
– A button to view the results via a Chart View
As already advised earlier, the By Interval screen now shows red/green table rows to indicate a downtrend or uptrend.
Please note that as a consequence of this update, the Product Statistics screen will be retired in 30 days time, as all its functions can now be provided through this new Sales Statistics screen
by Usama Ahmad | Aug 4, 2017 | New Features
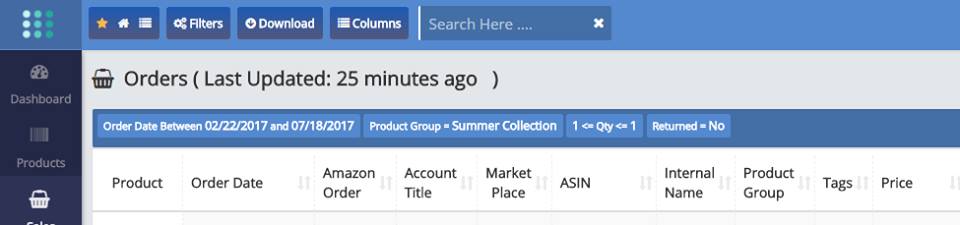
A long overdue feature.
When a table is filtered, the filtered field names and their filtered values are now displayed above the corresponding table.
This also works with Dashboard filters, by the way.
by Usama Ahmad | Jul 26, 2017 | New Features
Nothing earth-shattering, but something which has been a popular request for a while…
The product dashboard now has a widget which shows the same information as the Product Inventory Screen for a given product.
Saves you having to switch from the dashboard to the inventory screen and search for the product to see its inventory status.