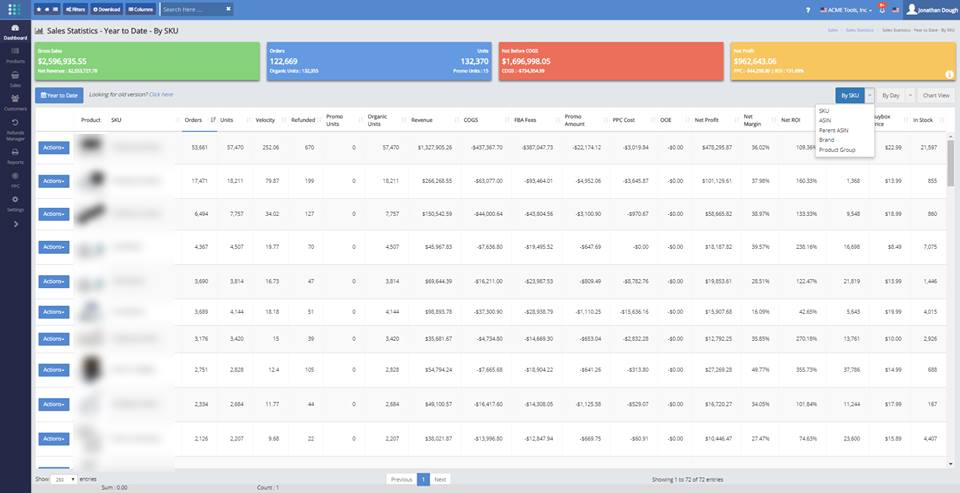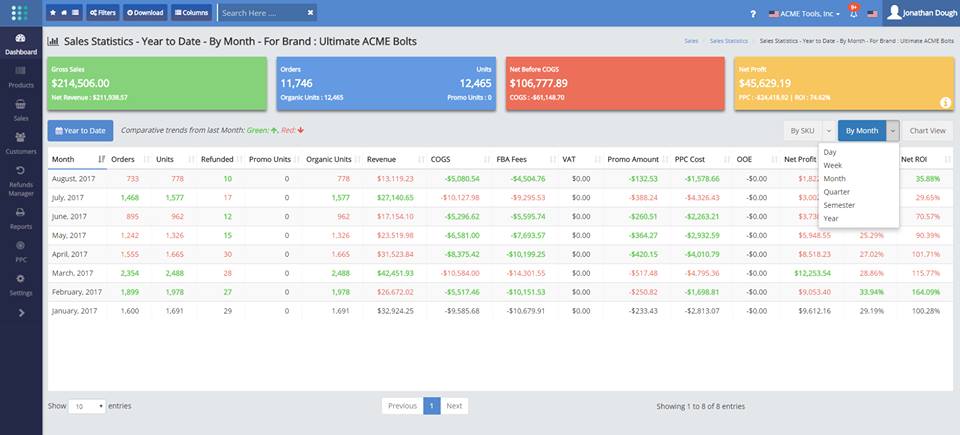
The sales statistics screen can now show the following combination of product sales data, over a user-selectable period of time:
– Sales By SKU
– Sales By ASIN
– Sales By Parent ASIN
– Sales By Product Group
– Sales By Brand
Moreover, for each of the above entities (SKU, ASIN, Parent ASIN, Product Group and Brand), you can show aggregate results by:
– Individual day during the selected period
– Individual week during the selected period
– Individual month during the selected period
– Individual quarter during the selected period
– Individual semester during the selected period, and
– Individual year during the selected period.
The screen now sports:
– A Period Selector
==> (Today, Yesterday, Last 7 Days, Last 30 Days, Last 90 Day, This Month, Last Month, Last 3 Months, Last Year, Year To Date, One Year, Custom)
– A Scope Selector
==> (By SKU, By ASIN, By Parent ASIN, By Brand, By Product Group)
– An Interval Selector
==> (By Day, By Week, By Month, By Quarter, By Semester, By Year)
– A button to view the results via a Chart View
As already advised earlier, the By Interval screen now shows red/green table rows to indicate a downtrend or uptrend.
Please note that as a consequence of this update, the Product Statistics screen will be retired in 30 days time, as all its functions can now be provided through this new Sales Statistics screen